LAYER OPACITY
LEGEND
DESCRIPTION
The DHIs are designed for biodiversity assessments and to describe habitats of different species. Three individual indices comprise the DHIs (Fig. 1):
- DHI cum – cumulative DHI, i.e., the area under the phenological curve of a year
- DHI min – minimum DHI, i.e., the minimum value of the phenological curve of a year
- DHI var – seasonality DHI, i.e., the coefficient of variation of the phenological curve of a year
Our DHIs from MODIS Terra/Aqua NDVI and EVI are based on 16-day composites, from MODIS LAI, fPAR, and GPP are 8-day composites.
Our DHIs from VIIRS data are based on 16-day composites.
Our DHIs from VIIRS data are based on 16-day composites.
There are two types of DHIs. The first are composite DHIs, which are based on the median observations for each time step (Fig. 1). The DHIs, especially minimum productivity, are sensitive to occasional changes in data values that are typical for MODIS and VIIRS data, as well as climate events, such as droughts that can affect data for a given year. For some biodiversity analyses, such as analyses of species richness based on range maps, this interannual variation is not relevant. This is why we derive a composite phenology curve from all MODIS or VIIRS data for a range of years. The composite phenology curve represents the median value for each of the observations that were available for each of the 23 or 46 time steps dependent on the MODIS input data. We then used this composite phenology curve to calculate the DHIs.
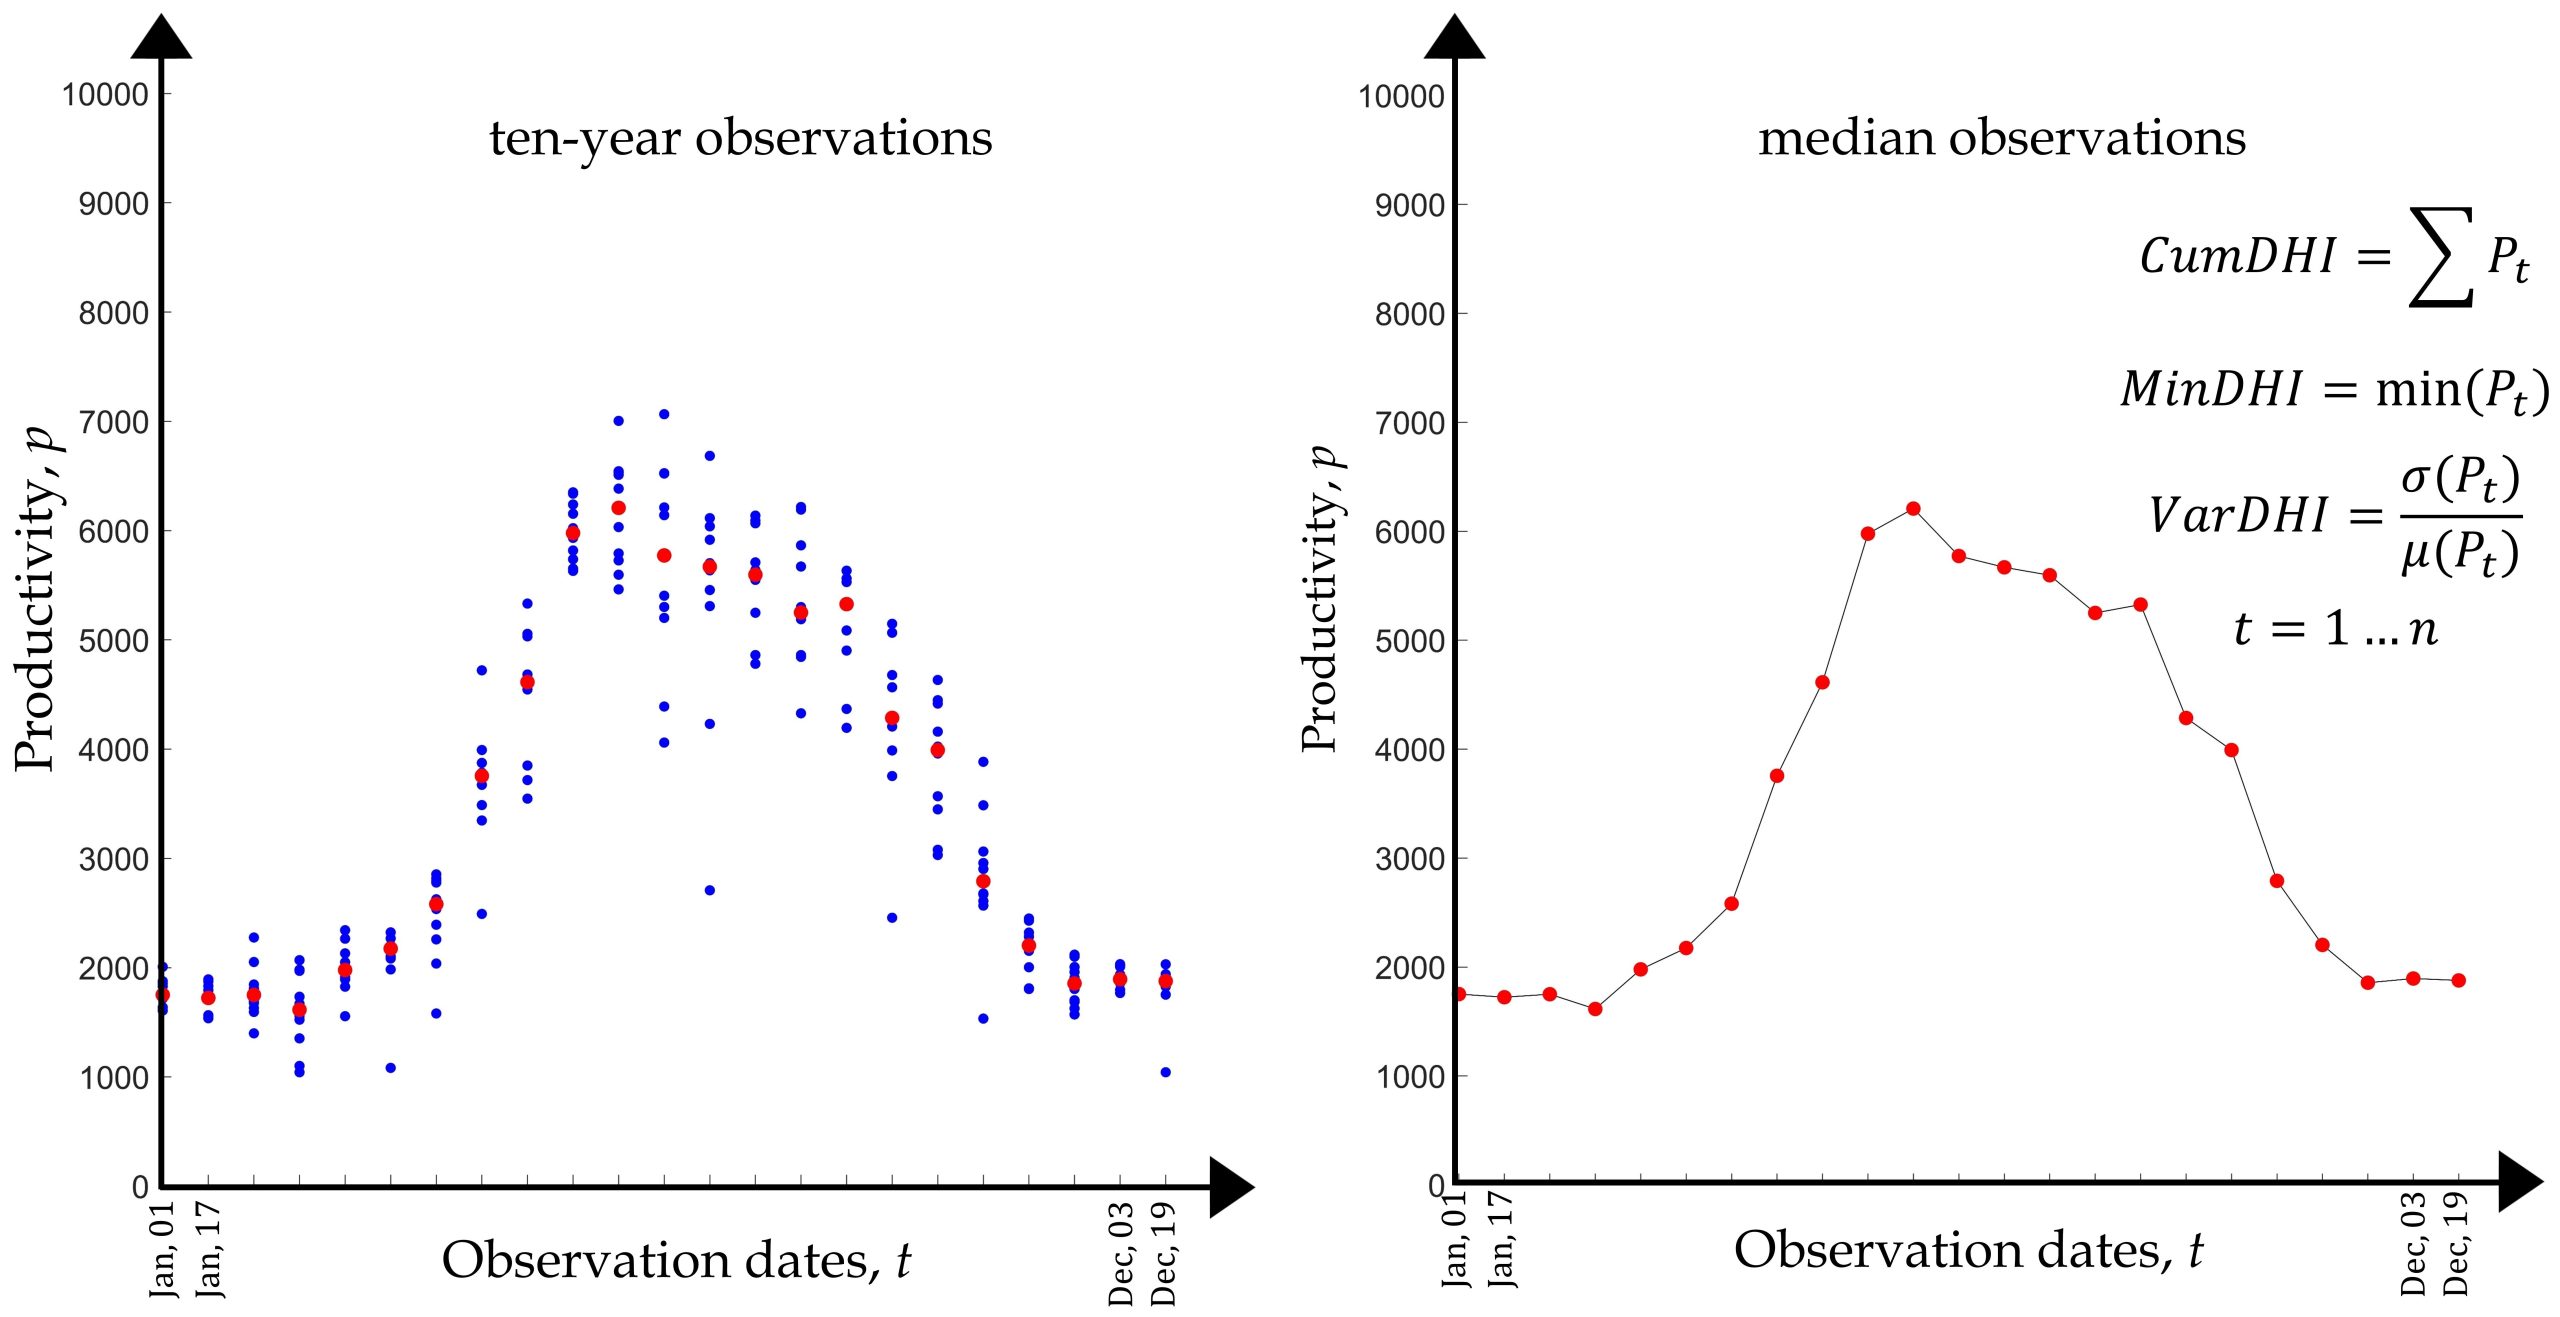
Fig. 1: Example of the calculation of a median phenology curve for ten years (left), and the subsequent calculation of the three DHIs based on those median observations (right).
The second are annual DHIs. To fill missing observations, and to eliminate noise from the raw data representing a yearly phenology curve, we applied a two-step filtering procedure. The steps included an iterative median and a Savitzky-Golay filter (Fig. 2). The main reason for our use of the iterative median filter is to eliminate noise that reflects depressed raw values. The subsequent Savitzky-Golay filter then smoothes teh phenology curve, and it is this smoothed curve which we use to calculate the three DHIs.
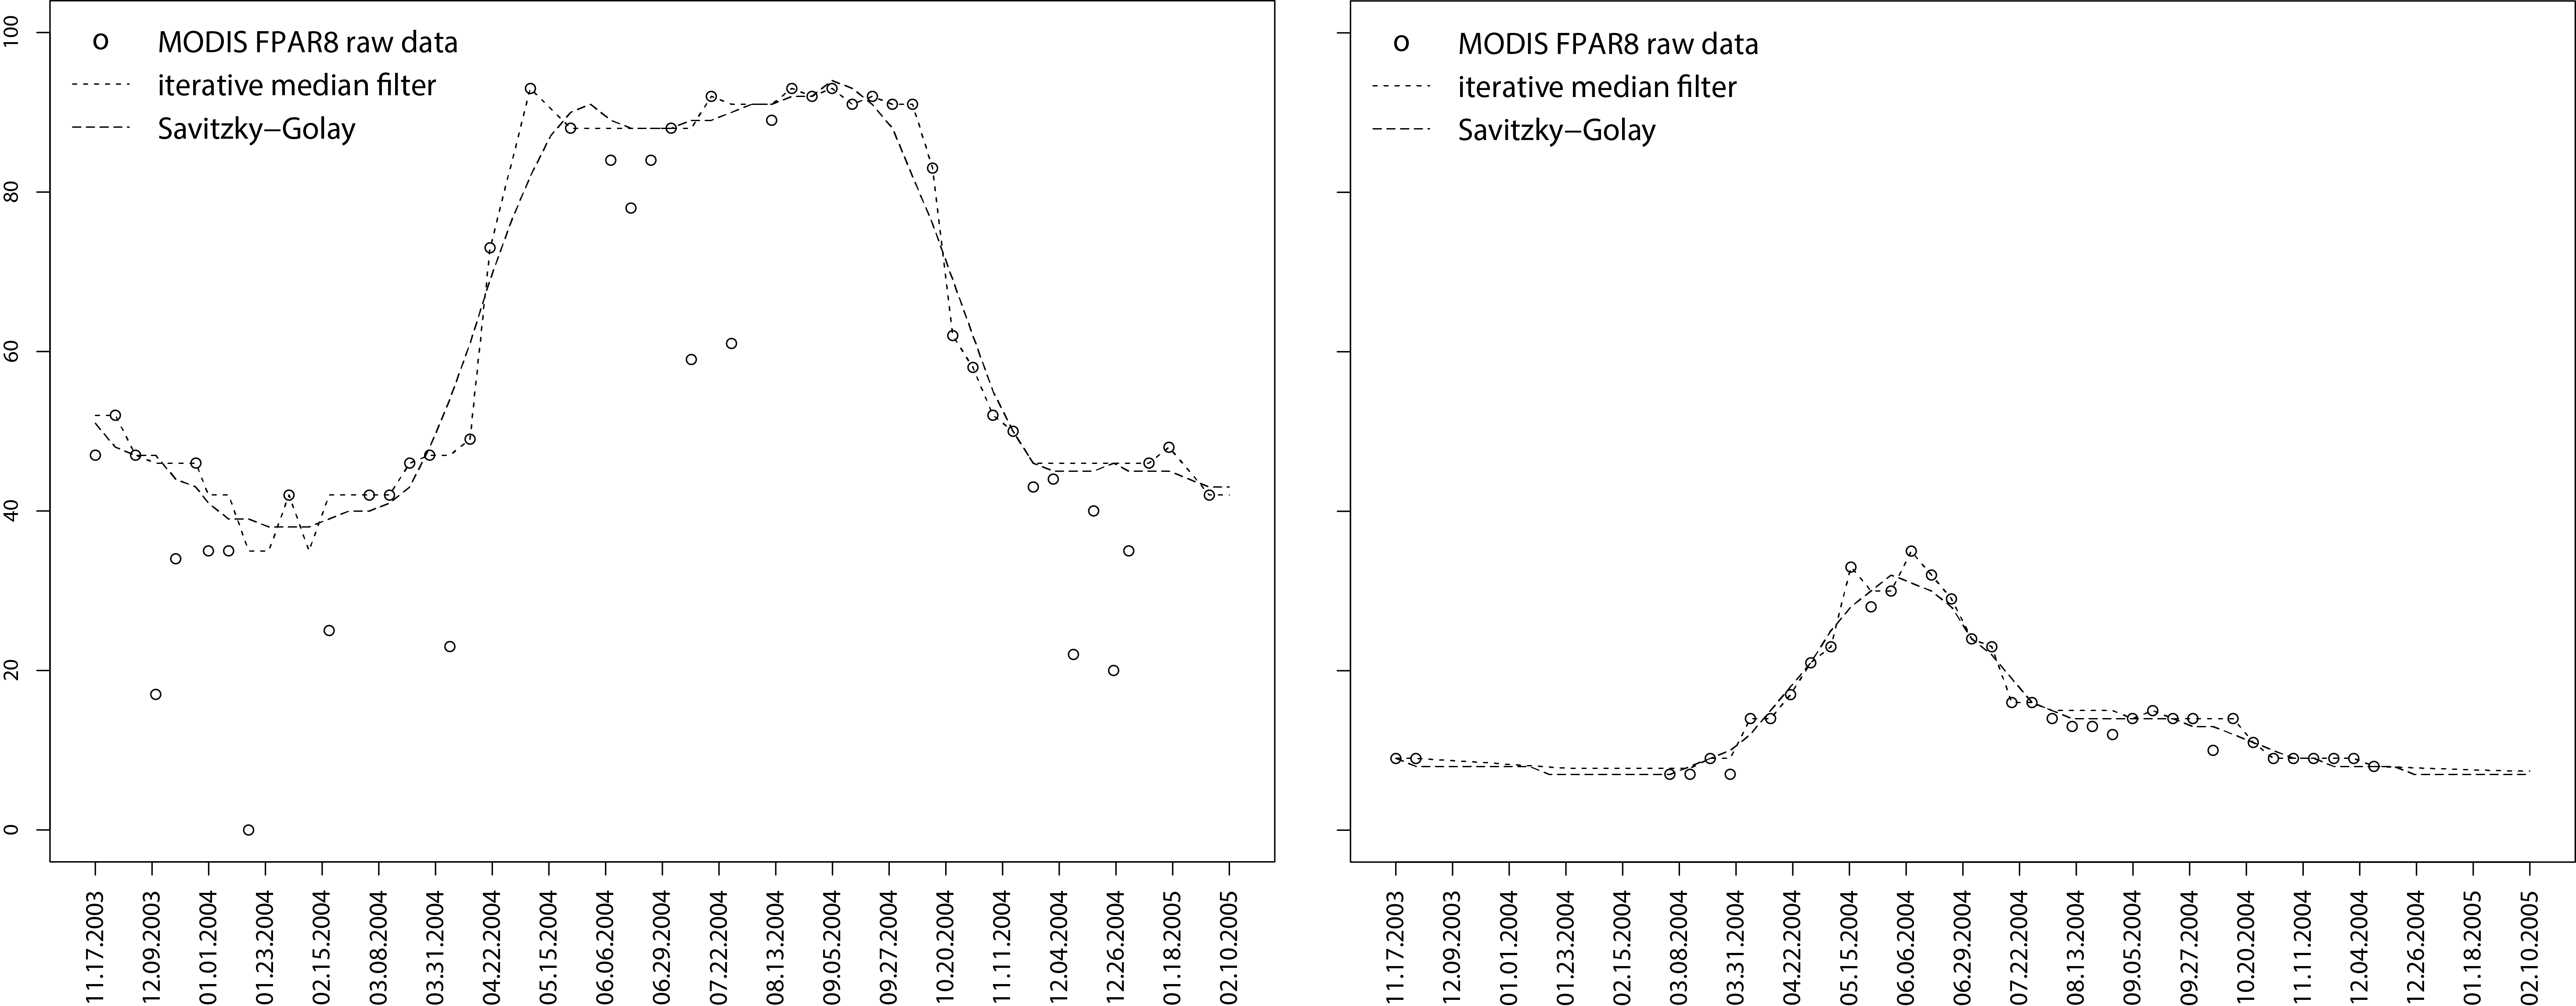
Fig. 2: Two example pixels and our application of the two filters based on MODIS FPAR data. The first filter is the iterative median filter and second one is the Savitzky-Golay filter which is applied after the first filter.
DOWNLOADS
COMPOSITE DHIs
| 10-YEAR | NDVI | EVI | LAI | fPAR | GPP | ||||
|---|---|---|---|---|---|---|---|---|---|
| SENSOR | 250m | 500m | 1km | 250m | 500m | 1km | 500m | 500m | 500m |
| MODIS Terra | 2013-2022 | 2013-2022 | 2013-2022 | 2013-2022 | 2013-2022 | 2013-2022 | 2013-2022 | 2013-2022 | 2013-2022 |
| MODIS Aqua | 2013-2022 | 2013-2022 | 2013-2022 | 2013-2022 | 2013-2022 | 2013-2022 | 2013-2022 | 2013-2022 | 2013-2022 |
| VIIRS | – | 2013-2022 | – | – | 2013-2022 | – | 2013-2022 | 2013-2022 | – |
| 5-YEAR | NDVI | EVI | LAI | fPAR | GPP | ||||
|---|---|---|---|---|---|---|---|---|---|
| SENSOR | 250m | 500m | 1km | 250m | 500m | 1km | 500m | 500m | 500m |
| MODIS Terra | 2018-2022 | 2018-2022 | 2018-2022 | 2018-2022 | 2018-2022 | 2018-2022 | 2018-2022 | 2018-2022 | 2018-2022 |
| MODIS Aqua | 2018-2022 | 2018-2022 | 2018-2022 | 2018-2022 | 2018-2022 | 2018-2022 | 2018-2022 | 2018-2022 | 2018-2022 |
| VIIRS | – | 2013-2022 | – | – | 2013-2022 | – | 2013-2022 | 2013-2022 | – |
| 3-YEAR | NDVI | EVI | LAI | fPAR | GPP | ||||
|---|---|---|---|---|---|---|---|---|---|
| SENSOR | 250m | 500m | 1km | 250m | 500m | 1km | 500m | 500m | 500m |
| MODIS Terra | 2020-2022 | 2020-2022 | 2020-2022 | 2020-2022 | 2020-2022 | 2020-2022 | 2020-2022 | 2020-2022 | 2020-2022 |
| MODIS Aqua | 2020-2022 | 2020-2022 | 2020-2022 | 2020-2022 | 2020-2022 | 2020-2022 | 2020-2022 | 2020-2022 | 2020-2022 |
| VIIRS | – | 2020-2022 | – | – | 2020-2022 | – | 2020-2022 | 2020-2022 | – |