Spatial Analysis For Conservation and Sustainability
Houses & WUI
Housing growth is rampant, and much of it occurs in or near wildland vegetation, i.e., in the Wildland Urban Interface or WUI. Such housing growth is bringing homeowners closer to nature, which is great, but also posing numerous environmental problems including changes to fire regimes, introduction of invasive species, more human-wildlife conflicts, and habitat fragmentation.
The wildland-urban interface (WUI) is the area where houses and wildland vegetation meet or intermingle, and where wildfire problems are most pronounced. Here we report that the WUI in the United States grew rapidly from 1990 to 2010 in terms of both number of new houses (from 30.8 to 43.4 million; 41% growth) and land area (from 581,000 to 770,000 km2; 33% growth), making it the fastest-growing land use type in the conterminous United States. The vast majority of new WUI areas were the result of new housing (97%), not related to an increase in wildland vegetation. Within the perimeter of recent wildfires (1990–2015), there were 286,000 houses in 2010, compared with 177,000 in 1990. Furthermore, WUI growth often results in more wildfire ignitions, putting more lives and houses at risk. Wildfire problems will not abate if recent housing growth trends continue.
Protected areas are crucial for biodiversity conservation because they provide safe havens for species threatened by land-use change and resulting habitat loss. However, protected areas are only effective when they stop habitat loss within their boundaries, and are connected via corridors to other wild areas. The effectiveness of protected areas is threatened by development; however, the extent of this threat is unknown. We compiled spatially-detailed housing growth data from 1940 to 2030, and quantified growth for each wilderness area, national park, and national forest in the conterminous United States. Our findings show that housing development in the United States may severely limit the ability of protected areas to function as a modern “Noah’s Ark.” Between 1940 and 2000, 28 million housing units were built within 50 km of protected areas, and 940,000 were built within national forests. Housing growth rates during the 1990s within 1 km of protected areas (20% per decade) outpaced the national average (13%). If long-term trends continue, another 17 million housing units will be built within 50 km of protected areas by 2030 (1 million within 1 km), greatly diminishing their conservation value. US protected areas are increasingly isolated, housing development in their surroundings is decreasing their effective size, and national forests are even threatened by habitat loss within their administrative boundaries. Protected areas in the United States are thus threatened similarly to those in developing countries. However, housing growth poses the main threat to protected areas in the United States whereas deforestation is the main threat in developing countries.
Protected areas are crucial for biodiversity conservation because they provide safe havens for species threatened by land-use change and resulting habitat loss. However, protected areas are only effective when they stop habitat loss within their boundaries, and are connected via corridors to other wild areas. The effectiveness of protected areas is threatened by development; however, the extent of this threat is unknown. We compiled spatially-detailed housing growth data from 1940 to 2030, and quantified growth for each wilderness area, national park, and national forest in the conterminous United States. Our findings show that housing development in the United States may severely limit the ability of protected areas to function as a modern “Noah’s Ark.” Between 1940 and 2000, 28 million housing units were built within 50 km of protected areas, and 940,000 were built within national forests. Housing growth rates during the 1990s within 1 km of protected areas (20% per decade) outpaced the national average (13%). If long-term trends continue, another 17 million housing units will be built within 50 km of protected areas by 2030 (1 million within 1 km), greatly diminishing their conservation value. US protected areas are increasingly isolated, housing development in their surroundings is decreasing their effective size, and national forests are even threatened by habitat loss within their administrative boundaries. Protected areas in the United States are thus threatened similarly to those in developing countries. However, housing growth poses the main threat to protected areas in the United States whereas deforestation is the main threat in developing countries.
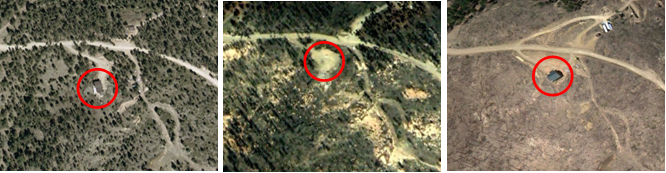
People enjoy building houses in beautiful places where they are surrounded by the beauty of nature. Unfortunately, when wildfires rage through forests, these homes are often caught in the fire’s path. As more and more people attempt to enjoy the amenities of building a home in sparsely populated areas, communities increasingly face tough decisions whether to pay for protecting these homes from wildfires that destroy property and take lives. Wildfire costs are not trivial. During the twelve-years from 1999-2011, an average of 1,354 houses were destroyed and approximately $2 billion was spent fighting wildfires, annually. Ideally, communities would have information to help predict how wildfires spread and how to minimize the number of houses lost during wildfires. Unfortunately, a lot of basic information about what happens to a community after a wildfire rips though it is unknown. Patricia Alexandre and her colleagues recently published a study that makes a first step towards describing what happens to communities across the country following wildfire events. While their results suggest that the conventional wisdom that rebuilding always happens has little support and how much is rebuilt varies across the country, they were surprised to find that new housing constructed in burned areas was happening at higher rates than rebuilding, and often at higher rates than in surrounding non-fire areas, adding complexity to the discussion.
Example of a rebuilt building situation when using Google Earth
To be clear, Alexandre’s research is not intended to answer whether people should rebuild following a wildfire, but to provide a snapshot of what the patterns were within affected communities across the country following recent fires. This is an important step to take to see whether patterns are consistent across a large scale and provides a dataset to begin drawing conclusions from observed rebuilding patterns. To do this work, Alexandre refined a method utilizing historical images available on Google Earth and then recruited help from students to go through and hand-digitize structures present before a fire as well as all structures that had burned, and consequently been rebuilt within five years following a fire. Nationally, the team found rebuilding rates averaged 25%, with much higher rates in the western states. For example, rates in California approached 70% of structures rebuilt following a fire. The surprising results from Alexandre’s work is first that not all burned communities are re-building within five years following a fire, and second that new buildings were constructed in burned areas at similar or even higher rates. These results indicate that communities are not just replacing homes lost to wildfires, but many are putting new homes into burned areas.
Percentage of burned buildings per fire (fires occurred between 2000 and 2005)
Alexandre offers multiple reasons that homeowners may build, and rebuild, in burned areas, which are inherently fire prone. One reason is that homeowners may find the value they get from living in fire-prone areas worth the fire risk, some insurance policies require rebuilding in the same spot following a fire, and many homeowners do not have the finances to relocate to an area with lower fire risk. While the reasons to build and rebuild in fire prone areas likely vary widely across the country, Alexandre’s research provides a valuable baseline to evaluate future policies or practices that communities might use to mitigate wildfire damages. Whether it’s mandating that new or rebuilt structures be constructed with safer materials, or prohibiting rebuilding in burned areas, the best way to evaluate the efficacy of these policies is to compare them to the housing patterns before and after fire events. Alexandre’s research allows that comparison to take place and hopefully inform local initiatives that could save property, money and lives.”
In an unusual twist, Paul Schilke’s interest in terrestrial birds has led him to study aquatic systems.
Map of study area (Chequamegon-Nicolet National Forest) with study sites and bodies of water.
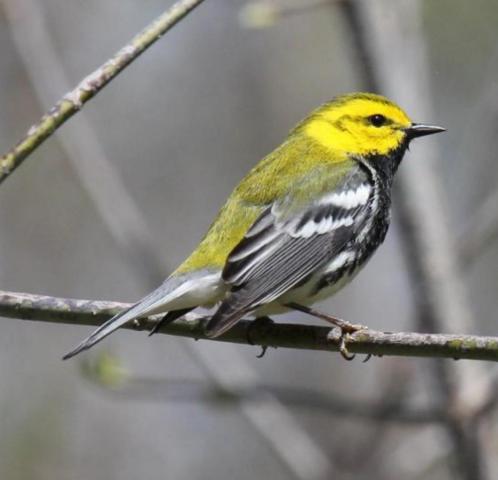
Many aerial insectivore bird species, such as swallows and flycatchers, have been declining since the 1980s, but researchers aren’t sure why because little is known about how these birds use the resources around them. This guild is defined by its habit of capturing flying insects in midair, as opposed to the gleaner guild that picks insects off of substrates like leaves or twigs. Many of these flying insects begin their lifecycle in aquatic systems, so Paul thought that the differential decline in the aerial feeding guild might lie in the lakes and streams.
Using records from 317 locations within the Chequamegon-Nicolet National Forest in Northern Wisconsin, Paul compared presence of the aerial and gleaner insectivore guild members to estimated insect productivity in nearby lakes and streams, controlling for habitat differences (Figure 1). He estimated insect probability using a model from Bartrons et al. (2013), which used an extensive meta-analysis to determine the relationships between aquatic insect productivity and basic properties of lakes and streams such as temperature, surface area, and clarity. As expected given their feeding behavior, gleaners preferred forested habitats while aerial insectivores preferred more open areas. Interestingly, despite both guilds being insectivorous, aerial feeders demonstrated a strong preference for sites with higher insect inputs, while gleaners had no response (Figure 2).
Figure 2. Scatter plot of response of aerial insectivores (left) compared to response of gleaners (right) to estimated emergent aquatic insect inputs.
Paul hopes that a better understanding of the food resources of aerial insectivores can lead to better conservation measures, and hopefully reverse their long term decline. He will continue his work as a PhD student in the SILVIS lab.
Wildfires are a major threat to houses and people in the US. About 2 billion dollars are spent every year in preventing and suppressing fires by the US Forest Service alone, and about 1,300 houses are burned each year on average. Housing is expanding every year and the number and frequency of wildfires in increasing as well, suggesting that this problem is likely to get worse in the future. Understanding the how wildfires affect houses, and what we can do to prevent those damages, is key to guide land-use planning and management efforts in fire prone places.
Cedar Fire in San Diego, CA in 2003, study area layout.Four Mile Fire in Boulder, CO in 2010, study area layout.
“People want nice views and to live out in the country, however, houses in such locations are under high risk of wildfires”, said Patricia Alexandre, a PhD student at Silvis. Understanding the factors that explain the likelihood of a house to burn during a wildfire is of major need for land-use planning in wildfire prone areas, and for agencies such as the US Forest Service. However, there is little knowledge on this topic according to Patricia. Patricia’s research focuses on identifying the key factors that explain the likelihood of a house to burn during a fire. For this, she is using two wildfires as case studies, including a wildfire that occurred in San Diego (California) and one in Boulder (Colorado). High resolution imagery before and after the fire is being used to map all the houses within those fires, that burned due to the fires. ‘In the Boulder fire for example, we mapped about 1100 houses, and we see that 10% of them were burned after the fire’, Patricia said.
The study explores about 40 environmental variables to predict the likelihood of a house to burn, such as vegetation conditions, topography (aspects, slope, elevation, topographic position), and the spatial arrangement of house (housing density, distance to near house). According to Patricia, predicting the likely of a house to burn is a complex task. “In Colorado, the houses most likely to burn were those on high slopes or on top of ridges, as well as those located at the edges of the neighborhoods. In San Diego, however, the results were more variable. What might explain things in one fire may not work in other.”
Another important finding from this study is that the spatial arrangement of the houses matters. According to Patricia, “previous efforts used only topography and spatial arrangement to predict the likelihood of a house to burn given a wildfire, but we decided to add vegetation to see how much in fact is vegetation contributing to this phenomenon. We see that vegetation alone cannot explain why a house burned alone, the way houses are arranged on the land is also important”. Currents efforts are focused towards refining the models so to have a better understanding of the local forces that result in burned houses within a single fire. However, the ultimate goal is to expand the study to the whole US.Patricia hopes that this study will help the government to allocate resources (e.g. fuel management) in a more efficient manner, and will provide land-use planners, urban planners, and home owners with useful information and recommendations about housing construction in wildfire-prone areas. This study is a step towards Patricia’s dissertation focused on understanding the factors that explain house loss to wildlife in the US. “My ultimate goal is to develop a risk map for the whole US that tells you how likely it is that your house burns if a fire occurs”, Patricia said.
It should be hard, but it’s not’, that’s how Shelley describes herding wolverines. Or, more accurately, administering a large new grant aimed at training the next generation of conservation-minded scientists. Research topics range from economics to entomology, genetics to geography. Research locations literally span the globe. But to Shelley, it’s a treat. What some might describe as complex or challenging, Shelley describes as ‘Getting to work with this amazing group of talented, intelligent and interesting people.’ The challenge is to figure out how to actually implement, in a concrete way, the lofty goals set out in the IGERT grant recently received by UW-Madison, and led by Volker Radeloff: ‘IGERT: Novel ecosystems, rapid change, and no-analog conditions: the future of biodiversity conservation in human-dominated landscapes.’ The IGERT is set to try to revolutionize how students are trained and collaboration occurs, and, in the process, push our understanding of novel ecosystems. As such the IGERT will tackle research questions such as: What are the drivers and future patterns of novel environments? How will species, communities, people and the environment be affected by and adapt to these novel conditions? How can conservation and management succeed given these changes? The goal is to foster graduate student research questions, while also enabling collaborative efforts. The model for the student training is Yo-Yo Ma, an unrivaled virtuoso, yet also a brilliant ensemble performer with musicians from the Silk Road to Appalachia to the Boston Philharmonic who is forever building bridges and charting new territories. The approach: to create a ‘community of practice’ comprised of committed members and centered on common goals and activities.
Training in conservation started with a strong focus on depth in ecology and little breadth. It became more interdisciplinary, in that ecologists now draw upon other disciplinary skill sets. Our vision is to broaden the base, and train students to truly collaborate towards a common goal.
Shelley’s first challenge is to encourage, cajole, create, and coordinate this community into being. Communities blossom when people have a good time together, so Shelley organizes trips -canoeing, hiking, skiing – that combine a healthy dose of fun, a little cooking, and a lot of time for chatting. To kick the community building effort off with a bang, she helped put together a week-long ‘Wisconsin Idea’ road trip last fall that showcased the great outdoors of northern Wisconsin, the changes in climate and land use that are occurring there, and the great people and organizations working to manage and conserve the landscape amidst these changes. Throughout the year, Shelley coordinates monthly ‘Conservation Salons’, a seminar with an aim to provide a casual environment to learn about interdisciplinary research in the context of novel ecosystems.
As a result of these and the many other efforts of Shelley, and all of the IGERT PIs, the project is already viewed as exciting and fun by students. They want to participate, look forward to getting to know each other and faculty members better, and are eager to come up with new ideas to do better research together. As the grant matures, and the number of students involved increases, Shelley’s focus will shift as well. That’s part of the excitement and challenge of helping to create something new and big. Thanks Shelley!”
Natural resource agencies and conservation organizations commonly develop plans to identify future conservation needs and priorities. However, many of these plans take into account only physical and biological properties of the landscape. This excludes a key consideration: the specific actions and processes that threaten the species and habitats we are trying to conserve. Plans that do not consider threats may identify many sites that are biologically valuable, but fail to highlight specific locations where conservation action is most urgently needed – sites where high biodiversity and high threat intersect.Housing development is a major threat to ecosystems in Wisconsin, as it is a major cause of habitat loss, fragmentation, and degradation. Housing development also often goes hand-in-hand with a number of other threats: increased noise, lighting, roads, human disturbance, predation from pets, and invasive species. This is why Sarah is using data on housing development to help agencies and conservation organizations target and schedule future conservation actions.
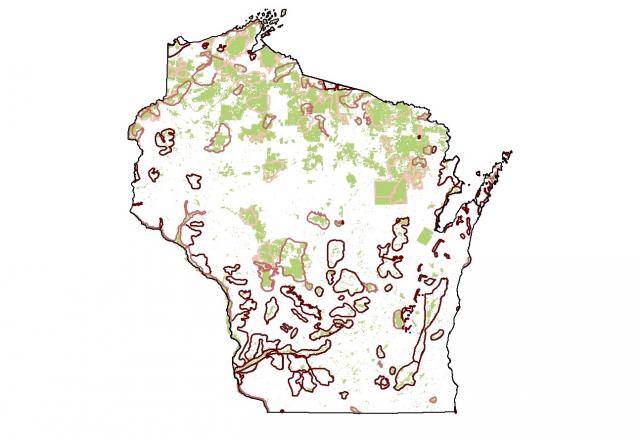
Vulnerability of priority areas in the Wildlife Action Plan.Priority areas in the Wildlife Action Plan exposed to differing levels of threat from current high density housing (high density housing is defined as greater than 1 housing unit per 40 acres of land).
Sarah’s work brings together three key pieces of information: 1) existing conservation plans that agencies and organizations have already developed, 2) projections of where housing growth is most likely to occur, and how fast that growth will be, and 3) data on how vulnerable individual priority areas are to future housing development.
Key categories of priority areas in the Wildlife Action Plan.
As a case study, Sarah looked first at Wisconsin’s Wildlife Action Plan, one of the suite of plans developed across the nation in 2005 to help target and coordinate conservation efforts to prevent future declines in wildlife populations.Using this approach, Sarah has shown that more than half of priority areas identified in Wisconsin’s Wildlife Action Plan are highly vulnerable to threat (Figure 1), and over 40% are already threatened by housing development (Figure 2). Priority areas in the Wildlife Action Plan exposed to differing levels of threat from current high density housing (high density housing is defined as greater than 1 housing unit per 40 acres of land).Sarah hopes that this work will help agencies, land trusts, and other conservation organizations in Wisconsin and elsewhere to be more strategic in their work by highlighting where we have very short windows of opportunity to protect key resources, where we have likely already achieved conservation success, and where lower development pressure will likely provide the longer time frame needed for new, large-scale conservation initiatives to be successful.”
If the opportunity were presented to live in a beautiful mountainous setting, surrounded by a natural landscape, chances are, many people would jump at this occasion. According to Patricia, ‘many of us want to live in a beautiful place and wake up with a cup of coffee viewing beautiful nature’. Yet, one problem with such ‘rural’ and ‘exurban’ development, in addition to the effects of housing development on biodiversity, is the potential threat of fires. Indeed, throughout the United States, the phenomenon of rural and exurban housing growth has increased within natural areas of public and private lands. Additionally, due to years of fire suppression, concentrated fuel loads have created conditions leading to higher frequency and intensity of fires. As a result, rural and exurban housing developments are at risk, which causes direct threats to lives as well as huge costs of fire fighting and prevention (Figure 1).
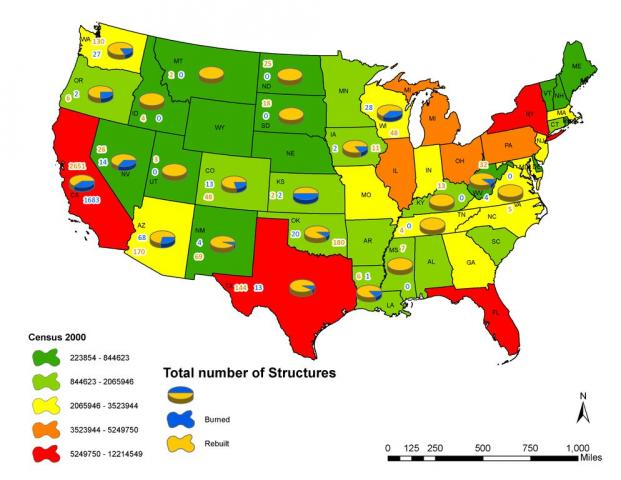
Total number of housing structures lost and rebuilt across the United States from 2000 to 2005.
Patricia Alexandre from UW-Madison, Miranda Mockrin from the US Forest Service, and a team of undergraduate researchers are investigating where fires are destroying homes throughout the United States using hand digitization with Google Map imagery, within all the fire perimeters from the Monitoring Trends of Burn Severity (MTBS) dataset that occurred between 2000 and 2005. The main goal of their project is to understand the spatial component of houses lost to fires as well as rebuilding efforts. Patricia wonders if the effects of fires on rural and exurban housing developments in one location of the country are similar in another location. The desired outcome from her work is to better allocate resources used for 1) fighting and preventing fires, and 2) protect homeowners from disastrous effects of fires.
Differences in housing units burned based on USGS mapped fires (green dots) and Google Earth hand digitized data (orange dots).
The outcomes of Patricia’s and Miranda’s work are targeted at federal, state, and private land managers as well as rural homeowners. Because the spatial component of her work is critical to understanding trends of housing loss to wildfires and rebuilding efforts, she hopes to provide maps informing preventative fire policy. Surely, these are results those of us hoping to one day live in a beautiful setting surrounding by nature can truly value.”
Today I’m sitting down with Dave Helmers, a GIS/Research Specialist in the SILVIS lab, to talk about his magic fingers.DL: So when you’re massaging US Census workers, do you use the same technique for everyone? Or are these individual-specific? Swedish or Shiatsu?DH: Ha. I don’t actually massage the workers themselves. What I do massage, though, are the data collected by those workers. I would argue that both are equally in need of a backrub.DL: Oh… I see… so why massage the data?DH: Out of the box, US Census data was not really designed for ecological research, but does provide a wealth of information that can be manipulated to answer ecological questions. Several questions of particular interest to the SILVIS lab have been how to map the Wildland Urban Interface (WUI; pronounced ‘WoooWeee’) across the conterminous US, and whether housing density has changed adjacent to protected lands over time. The census data comes in a database comprised of census blocks, where each block is of a various size and whose boundaries are generally defined by political instead of natural boundaries. Housing information is reported per census block – an administrative boundary with no information on where housing may or may not be distributed in actual space.DL: I see, this is similar to the work I do with weather radar, where I’m using it to study bird migration, an application for which it was never intended. We do some serious data massaging to correct for all sorts of atmospheric issues with the data. Okay, you’ve got my attention, so what exactly do you do with the census data?DH: My first order of business is to identify those areas where houses ‘can’t’ exist. These are areas in the public domain; protected areas, national parks, reserves, etc. I call this the ‘public land adjustment’ (PLA). To do this I overlay a public lands spatial database with the census data to partition each census block into public and private areas. I then reallocate all of the housing numbers to just the private zones of blocks.
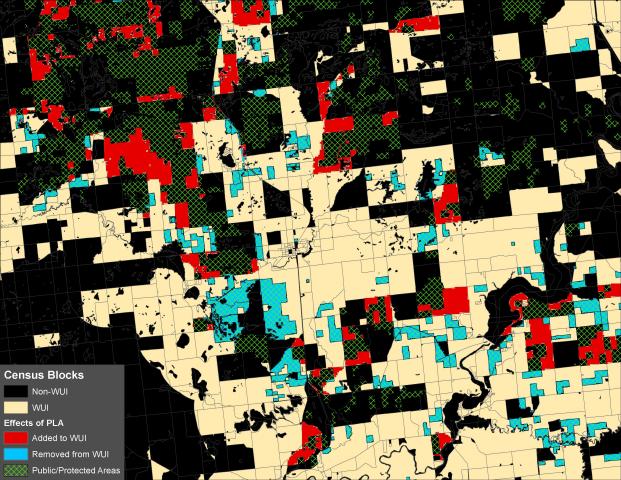
Map of a portion of Manistee National Forest (Michigan) showing the effects of the public land adjustment (PLA) on WUI mapping. Blue areas are block portions that fall within public/protected areas (no housing) and are removed from WUI. Red areas show newly concentrated housing block portions that now have enough density to qualify as WUI.
DL: Aha, so this correctly allocates density to the spatial region where houses are allowed, which is important when you’re trying to understand how housing pressures are changing over time, or when defining risks to fires, etc.DH: Exactly. For instance, in the western US, where population density is lower, census blocks are typically much larger and may encompass a large proportion of public lands. Add to this the prevalence of large fires and you start to see the importance of accurate housing density numbers to correctly designate WUI status and to understand the spatial arrangement of high-fire-danger zones. Since the WUI designation is based on housing density (at least 1 housing unit per 40 acres), if we’re going to use census data to map the WUI, we need to have a spatially accurate measure of housing.DL: So is that the only massaging you do to the census data?DH: No, not at all. The other big knot we have to work out, if you will, is the fact that census blocks may change in shape and size from one Census to the next (the US census takes place every 10 years) so even if we know that the raw numbers of houses have gone up or down between periods, we can’t actually say anything about housing density until we account for any spatial changes. To deal with this we overlay the perimeters of three time periods (spanning 30 years) for each census block and map those areas that are shared between them, and those which differ, and compute a time-corrected housing allocation for each resulting polygon. Effectively this allows us to correct for spatial variation in census blocks and make comparisons of housing density across time.
To look at the problem of mismatching 1990 and 2000 census boundaries, let’s take a look at a few counties in Oregon. On the left we see 2000 block boundaries in white overlain on black 1990 boundaries. There is some correspondence but many 1990 boundaries are evident within 2000 blocks, especially in the northern or upper parts of the counties. On the right we see black 1990 boundaries overlain on white 2000 boundaries. Here there are many 1990 blocks that contain several 2000 blocks.
DL: Wow! That sounds like a lot of work, but in the end you’ve got an ecologically relevant product.DH: Yeah, that’s the idea. So the two main questions we’ve been asking with this dataset in the SILVIS lab are ‘how is the WUI changing over time’ and this includes some modeling efforts to predict how it will expand or contract in the future. We’re also asking ‘how does housing density change with respect to protected areas’. Since we see proximity to protected areas as a desirable lifestyle choice, we predict that housing density should increase near these areas. By correctly appropriating the housing numbers to those areas where houses may be built, and by correcting for the changes in census blocks over the years, we have been able to demonstrate that indeed housing around protected areas has increased and that this is having an effect on some guilds of birds. That last bit is from work done by Eric Wood and currently in review.
Animation showing housing growth around Great Smoky Mountains National Park between 1940 and 2010.
DL: So are these datasets and products you’re creating for in-house use, or are they available to the public?DH: We serve this data to the public in several forms, ready-to-use maps of housing density and housing density change over time, as well as the geospatial (GIS) data for additional crunching should someone be interested in using it for an analysis. These data area available on our website at the following links:https://russell-silvis.webhosting.cals.wisc.edu/maps/housinghttps://russell-silvis.webhosting.cals.wisc.edu/maps/wuiDL: One last question, so what cool products should we be looking for coming out of the SILVIS massage parlor in the near future?DH: I think the next coolest product will be the WUI change map. Everyone wants to see this, especially the US Forest Service, but the impacts of this dataset will be far-reaching from basic science to management applications, to insurance adjusting. As the U.S. population increase and the old paradigm of having to live near your work degrades, we’re going to see more people living in fire-prone ecosystems. If the climate predictions are accurate, and extreme weather events are going to increase, this type of data is going to be super relevant.DL: It sounds like your masseuse skills are being put to good use. Thanks for taking the time to talk, now if you would, I’ve got this knot on the right side here…”
Many people – including many ecologists – dream of a home or cabin in the wilderness as an escape from urban life. The downside of this dream is strong development pressure on inholdings and along the boundaries of National Forests, National Parks, and other protected areas. Is it possible that the appeal of these areas is leading to the degradation of the resources they were designed to protect? Eric Wood, a postdoctoral researcher in the SILVIS lab is considering just this question. ‘Housing growth inside and on the boundaries of protected areas has dramatically increased over the last half-century or so. We really have no idea what that is doing to biodiversity within the protected area’, notes Eric. In order investigate this question, he is comparing the composition of bird communities within, on the boundaries of, and outside of protected areas, and relating this community composition to the level of development. Eric’s research is showing two different stories, one in the western United States, and one in the East.. ‘Housing [density] adjacent to protected areas is highest in the east’, said Eric (Fig. 2).
Wood’s study design and maps of housing density throughout the United States from 1970 to 2010.
From 1970 to -2010, Eric found a strong negative correlation between housing in inholdings and abundance of species of greatest conservation need (SGNC) and land cover affiliates (e.g., species associated with the dominant land cover of a BBS route – such as forest breeders in forested regions) in three of four regions of the United States (Fig. 3). Synanthropes, species closely associated with human development, showed a strong positive relationship with inholding development in these same regions (Fig. 3).
Relationship (regression coefficient) of housing density and the proportional abundance of species of greatest conservation need (SGCN), land cover affiliates (e.g. forest breeders in forested regions, etc.), and synanthropes in four regions of the United States from 1970 to 2010.
Eric also found that housing development along the boundaries of protected areas had a negative effect on SGCNs and no effect on synanthropes within the protected area. This appears to show that synanthropes are mostly affected by development patterns locally, while SGCNs are influenced by land use both locally and over very broad areas. Eric’s analysis shows that in the western United States, the relationships between housing developments and birds are similar, but much weaker in strength (Fig. 3). This is because, in comparison to the East, housing development in and around protected areas in the West is relatively low. This doesn’t mean there is no cause for concern though, as growth rates for development in the West are very high. It seems likely that what has already happened in the eastern United States is now in progress in the West. This means that it is important to keep these effects in mind as development continues. Eric has several suggestions how to remedy this situation. First, non-developed lands outside of high-priority protected areas should remain undeveloped as much as possible. Where there is development, it is possible that better planning, such as concentrating development in fewer, dense clusters may have less impact. Lastly, public land managers must educate nearby landowners through outreach about the risks development poses to natural areas, for example the spread of exotic invasive species or depredation of birds by pet cats. Eric is now using historical sources of bird and land use data to examine how these trends in development and their effects on the bird community have changed over time.”