Spatial Analysis For Conservation and Sustainability
Remote Sensing
Satellite images provide a wonderful record of the last fifty years of global change. We have pioneered new methods to map wildlife habitat and proxies for biodiversity and habitat, as well as agricultural abandonment and other types of land use change for large areas. We analyze MODIS/VIIRS data across the globe, Landsat and Sentinel-2 across continents, and high-resolution CORONA spy satellite imagery across countries.
After the collapse of the Soviet Union, the forestry sector in Russia underwent substantial changes: the state forestry sector was decentralized, the timber industry was privatized, and timber use rights were allocated through short- and long-term leases. To date, there has been no quantitative assessment of the drivers of timber harvesting in European Russia following these changes. In this paper we estimate an econometric model of timber harvesting using remote sensing estimations of forest disturbance from 1990-2000 to 2000-2005 as our dependent variable. We aggregate forest disturbance to administrative districts - equivalent to counties in the United States - and test the impact of several biophysical and economic factors on timber harvesting. Additionally, we examine the impact that regions - equivalent to states in the United States and the main level of decentralized governance in Russia - have on timber harvesting by estimating the influence of regional-level effects on forest disturbance in our econometric model. Russian regions diverged considerably in political and economic conditions after the collapse of the Soviet Union, and the question is if these variations impacted timber harvesting after controlling for district-level biophysical and economic drivers. We find that the most important drivers of timber harvesting at the district level are road density, the percent of evergreen forest, and the total area of forest. The influence of these variables on timber harvesting changed over time and there was more harvesting closer to urban areas in 2000-2005. Even though district-level variables explain more than 70 percent of the variation in forest disturbance in our econometric model, we find that regional-level effects remain statistically significant. While we cannot identify the exact mechanism through which regional-level effects impact timber harvesting, our results suggest that sub-national differences can have a large and statistically significant impact on land-use outcomes and should be considered in policy design and evaluation.
Heat waves are expected to become more frequent and severe as climate changes, with unknown consequences for biodiversity. We sought to identify ecologically-relevant broad-scale indicators of heat waves based on MODIS land surface temperature (LST) and interpolated air temperature data and assess their associations with avian community structure. Speci ? cally, we asked which data source, time periods, and heat wave indices best predicted changes in avian abundance and species richness. Using mixed effects models, we analyzed associations between these indices and data from the North American Breeding Bird Survey in the central United States between 2000 and 2007 in four ecoregions and ? ve migratory and nesting species groups. We then quanti?ed avian responses to scenarios of severe, but commonly-occurring early, late, and summer-long heat waves. Indices based on MODIS LST data, rather than interpolated air temperatures, were more predictive of avian community structure. Avian communities were more related to 8-day LST exceedances (positive anomalies only); and were generally more sensitive to summer-long heat waves. Across the region, abundance, and to a lesser extent, species richness, declined following heat waves. Among the ecoregions, relationships were most consistently negative in the southern and montane ecoregions, but were positive in a more humid northern ecoregion. Among migratory groups, permanent resident species were the most sensitive, declining in abundance following a summer-long heat wave by 19% and 13% in the montane and southern ecoregions, respectively. Ground-nesting species, which declined in the south by 12% following a late summer heat wave, were more sensitive than avifauna overall. These results demonstrate the value of MODIS LST data for measuring ecologically-relevant heat waves across large regions. Ecologically, these ? ndings highlight the importance of extreme events for avian biodiversity and the considerable variation in response to environmental change associated with different functional groups and geographic regions. The magnitude of the relationships between avian abundance and heat waves reported here raises concerns about the impacts of more frequent and severe heat waves in a warming climate.
Farmland abandonment restructures rural landscapes in many regions worldwide in response to gradual industrialization and urbanization. In contrast, the political breakdown in Eastern Europe and the former Soviet Union triggered rapid and widespread farmland abandonment, but the spatial patterns of abandonment and its drivers are not well understood. Our goal was to map post-Socialist farmland abandonment in Western Ukraine using Landsat images from 1986 to 2008, and to identify spatial determinants of abandonment using a combination of best-subsets linear regression models and hierarchical partitioning. Our results suggest that farmland abandonment was widespread in the study region, with abandonment rates of up to 56%. In total, 6600 km 2 (30%) of the farmland used during socialism was abandoned after 1991. Topography, soil type, and population variables were the most important predictors to explain substantial spatial variation in abandonment rates. However, many of our a priori hypotheses about the direction of variable in?uence were rejected. Most importantly, abandonment rates were higher in the plains and lower in marginal areas. The growing importance of subsistence farming in the transition period, as well as off-farm income and remittances likely explain these patterns. The breakdown of socialism appears to have resulted in fundamentally different abandonment patterns in the Western Ukraine, where abandonment was a result of the institutional and economic shock, compared to those in Europe's West, where abandonment resulted from long-term socio-economic transformation such as urbanization and industrialization.
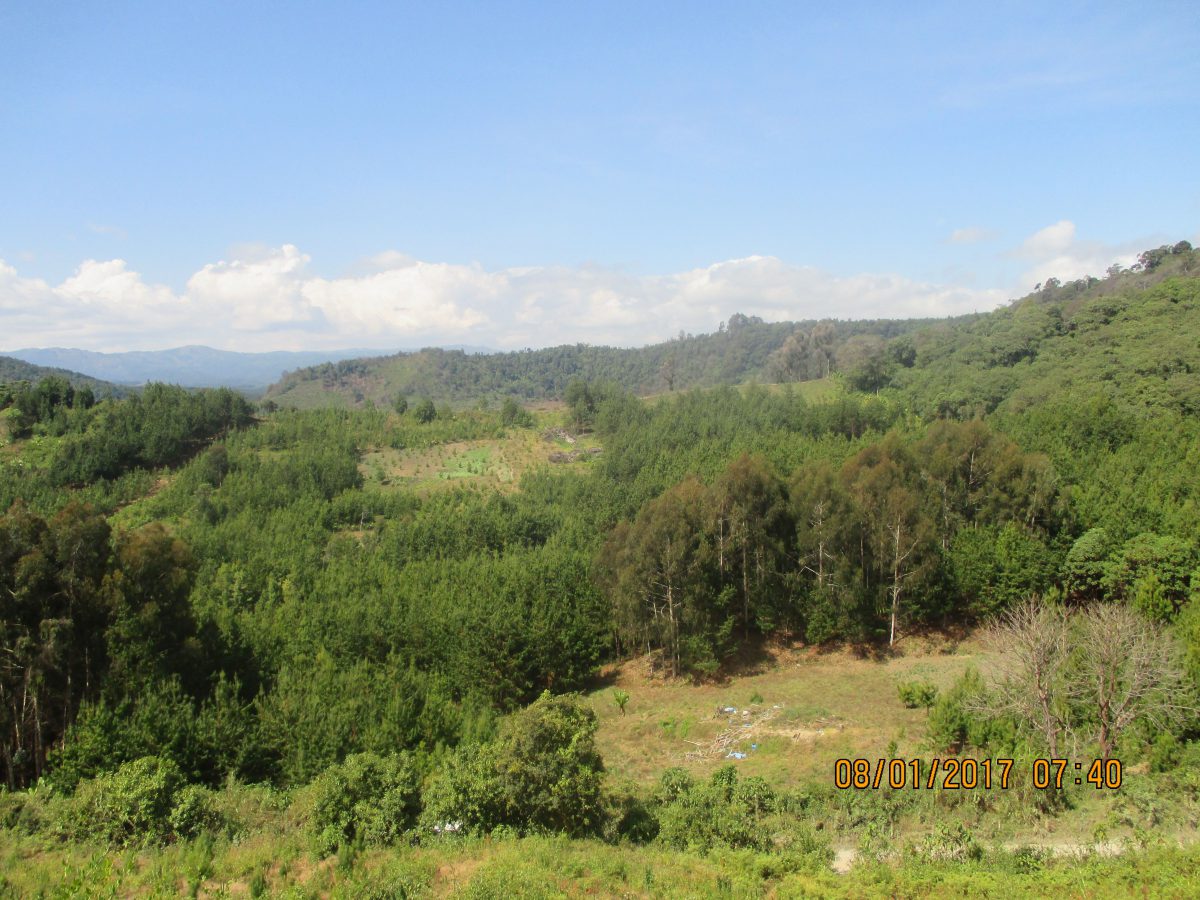
Niwaeli’s interest in smallholder woodlots started when she was conducting her Master’s research in Tanzania, at the southern end of the East African Rift. She saw rural farmers planting pine and eucalyptus in farms that are located near a forest edge on land that had been fallow for 15 years. Her collaborators, working at another forest edge site in the Uganda portion of the Rift, were noticing a similar conversion from cropland to tree plantations. She wanted to know how much smallholder tree planting was occurring near Rift forests, and why.
Niwaeli used Google Earth to get a first impression of the distribution of woodlots. She randomly selected 60 locations in a small portion of the Rift, and digitized all the woodlots in the area. So far the team has digitized more than 4000 individual woodlots. “The really striking thing is how small these woodlots are: 93% are less than 1 hectare, and the average area is 0.45 hectares”, she said. Niwaeli extrapolated the area of woodlots she found in the digitized subset to the entire Tanzanian Southern Highlands area and estimated 80.000 ha of smallholder woodlots. That does not sound like a big number, however, it is only ~ 10.000 ha less than the amount held by the biggest tree plantation owner, the Tanzanian government. A big question remains though: Why would a subsistence farmer plant trees with a slow turnaround rate, instead of growing food crops?
A Google Earth view showing woodlot patches (orange outlines) mixed with other land uses away from the forest edge.
In contrast to the US where farmers tend to own large and contiguous fields, in Niwaeli’s study site, farmers tend to own multiple small parcels of land that are spread throughout the landscape. Niwaeli thinks that the farmers make some allocation choices about which pieces of land will have crops, and which ones will have trees. She assumes that those parcels that are closer to the edge of the forests are not that great for growing food crops and are used for planting trees if the farmer can grow food somewhere else. “This could explain our initial field observations where we saw trees near forest edges” she added.
From the digitization, however, Niwaeli has seen that the woodlots are not limited to just forest edges, so the question of how farmers allocate land to trees is yet to be fully answered. She plans to further investigate the spatial distribution of tree plantations by mapping woodlots using Sentinel-2 satellite imagery. This will also provide a more accurate quantification of woodlot extent; and allow her to explore why some areas end up with woodlots while others do not.
Understanding past and current patterns of species richness is essential for predicting how these patterns may be affected by future global change. The species energy hypothesis predicts that higher abundance and richness of animal species occur where available energy is higher and more consistently available. There is a wide range of remote sensing proxies for available energy, such as vegetation productivity, but it is not clear which best predict species richness. Our goal here was to evaluate different proxies for annual plant productivity from Terra and Aqua Moderate Resolution Imaging Spectroradiometer (MODIS) as input for the Dynamic Habitat Indices (DHIs), and to determine how well they predict the richness of breeding bird species in six functional guilds across the conterminous United States. The DHIs are measures of vegetation productivity over the course of a year and consist of three components: (1) cumulative productivity (DHI Cum), (2) minimum productivity (DHI Min), and (3) intra-annual variation of productivity (DHI Var). We hypothesized that increases in cumulative and minimum productivity and reductions in intra-annual variation will be associated with higher species richness. We calculated the DHIs from a range of MODIS 1000-m vegetation productivity data sets for 2003– 2014, i.e., the Normalized Difference Vegetation Index (NDVI), Enhanced Vegetation Index (EVI), Fraction of absorbed Photosynthetically Active Radiation (FPAR), Leaf Area Index (LAI), and Gross Primary Productivity (GPP). We summarized bird species richness of different guilds within ecoregions (n = 85) based on abundance maps derived from the N3000 routes of the North American Breeding Bird Survey for 2006 to 2012. Generally, we found all the DHIs had high explanatory power for predicting breeding bird species richness. However, the strength of the associations between the DHIs and bird species richness depended on habitat, nest placement, and migratory behavior. We found highest correlations for habitat-based guilds, such as grassland breeding species (R2 adj 0.66–0.73 for the multiple DHI regression model; R2 adj 0.41–0.61 for minimum DHI) and woodland breeding species (R2 adj 0.34–0.60 for the multiple DHI regression model; R2 adj 0.26–0.51 for cumulative DHI). The strong relationship between the DHIs and bird species richness reinforces the importance of vegetation productivity as a determinant of species diversity patterns, and the usefulness of satellite data for applying the species energy hypothesis to predictions in service to conservation.
Agricultural land abandonment is a common land-use change, making the accurate mapping of both location and timing when agricultural land abandonment occurred important to understand its environmental and social outcomes. However, it is challenging to distinguish agricultural abandonment from transitional classes such as fallow land at high spatial resolutions due to the complexity of change process. To date, no robust approach exists to detect when agricultural land abandonment occurred based on 30-m Landsat images. Our goal here was to develop a new approach to detect the extent and the exact timing of agricultural land abandonment using spatial and temporal segments derived from Landsat time series. We tested our approach for one Landsat footprint in the Caucasus, covering parts of Russia and Georgia, where agricultural land abandonment is widespread. First, we generated agricultural land image objects from multi-date Landsat imagery using a multiresolution segmentation approach. Second, we estimated the probability for each object that agricultural land was used each year based on Landsat temporal-spectral metrics and a random forest model. Third, we applied temporal segmentation of the resulting agricultural land probability time series to identify change classes and detect when abandonment occurred. We found that our approach was able to accurately separate agricultural abandonment from active agricultural lands, fallow land, and re-cultivation. Our spatial and temporal segmentation approach captured the changes at the object level well (overall mapping accuracy = 97 ± 1%), and performed substantially better than pixel-level change detection (overall accuracy = 82 ± 3%). We found strong spatial and temporal variations in agricultural land abandonment rates in our study area, likely a consequence of regional wars after the collapse of the Soviet Union. In summary, the combination of spatial and temporal segmentation approaches of time-series is a robust method to track agricultural land abandonment and may be relevant for other land-use changes as well.
People enjoy building houses in beautiful places where they are surrounded by the beauty of nature. Unfortunately, when wildfires rage through forests, these homes are often caught in the fire’s path. As more and more people attempt to enjoy the amenities of building a home in sparsely populated areas, communities increasingly face tough decisions whether to pay for protecting these homes from wildfires that destroy property and take lives. Wildfire costs are not trivial. During the twelve-years from 1999-2011, an average of 1,354 houses were destroyed and approximately $2 billion was spent fighting wildfires, annually. Ideally, communities would have information to help predict how wildfires spread and how to minimize the number of houses lost during wildfires. Unfortunately, a lot of basic information about what happens to a community after a wildfire rips though it is unknown. Patricia Alexandre and her colleagues recently published a study that makes a first step towards describing what happens to communities across the country following wildfire events. While their results suggest that the conventional wisdom that rebuilding always happens has little support and how much is rebuilt varies across the country, they were surprised to find that new housing constructed in burned areas was happening at higher rates than rebuilding, and often at higher rates than in surrounding non-fire areas, adding complexity to the discussion.
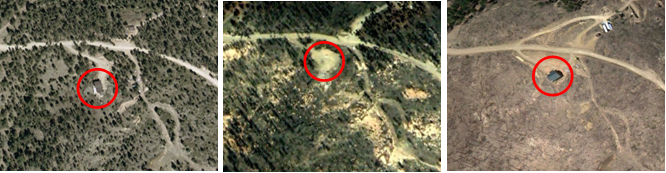
Example of a rebuilt building situation when using Google Earth
To be clear, Alexandre’s research is not intended to answer whether people should rebuild following a wildfire, but to provide a snapshot of what the patterns were within affected communities across the country following recent fires. This is an important step to take to see whether patterns are consistent across a large scale and provides a dataset to begin drawing conclusions from observed rebuilding patterns. To do this work, Alexandre refined a method utilizing historical images available on Google Earth and then recruited help from students to go through and hand-digitize structures present before a fire as well as all structures that had burned, and consequently been rebuilt within five years following a fire. Nationally, the team found rebuilding rates averaged 25%, with much higher rates in the western states. For example, rates in California approached 70% of structures rebuilt following a fire. The surprising results from Alexandre’s work is first that not all burned communities are re-building within five years following a fire, and second that new buildings were constructed in burned areas at similar or even higher rates. These results indicate that communities are not just replacing homes lost to wildfires, but many are putting new homes into burned areas.
Percentage of burned buildings per fire (fires occurred between 2000 and 2005)
Alexandre offers multiple reasons that homeowners may build, and rebuild, in burned areas, which are inherently fire prone. One reason is that homeowners may find the value they get from living in fire-prone areas worth the fire risk, some insurance policies require rebuilding in the same spot following a fire, and many homeowners do not have the finances to relocate to an area with lower fire risk. While the reasons to build and rebuild in fire prone areas likely vary widely across the country, Alexandre’s research provides a valuable baseline to evaluate future policies or practices that communities might use to mitigate wildfire damages. Whether it’s mandating that new or rebuilt structures be constructed with safer materials, or prohibiting rebuilding in burned areas, the best way to evaluate the efficacy of these policies is to compare them to the housing patterns before and after fire events. Alexandre’s research allows that comparison to take place and hopefully inform local initiatives that could save property, money and lives.”
Konrad Turlej, who brought his great expertise of remote sensing to SILVIS, enthusiastically started his PhD project in 2015 focusing on the mapping of tree species in Poland and in Wisconsin. The idea of the project is to map Polish and Wisconsin forests with 20-30 m resolution imagery. Konrad’s goal is ambitious: he wants to map not only where forests are, but also tree species with this medium resolution satellite data.
The reason why this is complicated is that a single tree is less than 30 mand there can be 2-4 trees species in a single pixel. Furthermore, in a satellite image, many tree species look very similar during the peak of summer. However, phenology varies greatly among tree species. Some trees have their leaves earlier, some ater. In the fall, some trees are losing leaves in September while others keep them till the first frost.
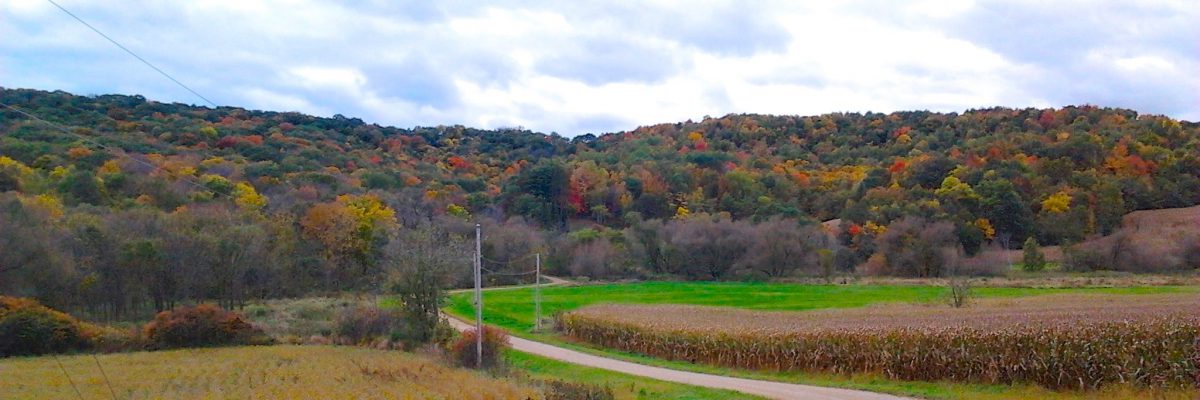
Forest Study Areas in Poland and Wisconsin
By analyzing satellite images for the entire growing season, one can analyzes so-called phenology curves. Over the course of a year, this curve looks different for different species because of phenological differences. This idea sounds quite promising but there is another challenge: Landsat, the source of 30 m imagery, provides only 1-2 images per months. In Poland, where leaves can fully come out in two weeks, this is not frequent enough to build a good phenological curve. This is why Konrad will combine Landsat data with imagery from other satellite sensors, including MODIS and Sentinel 2a.
Ultimately, the maps that Konrad is creating will be beneficial for several purposes. Describing and counting trees in the field takes a lot of time and money. Mapping maps of tree species from satellite images instead will save money and provide more timely information. With such maps, foresters can then estimate current situation on various species, amount of timber and its economic value, and eventually provide better management.
Climate change, fluctuating extreme weather conditions, and the resulting change in species’ abundance and distribution, are a major concern for managers of protected areas. The uncertainty of which species will disappear from a protected area, and which will arrive leads to difficulties in creating conservation goals at both small and large scales. In addition, what role do these protected areas serve during extreme conditions, such as intense heat waves or severe drought, for the species that remain remain? Drs Brooke Bateman, Andrew Allstadt, and Anna Pidgeon have been travelling to meet with managers to show results from their work investigating extreme weather events and changing climate on species populations and distributions. Involving end user and conservation practitioners to provide feedback on their reserach throughout their project is an ideal way to keep their research goals in line with practical on the ground conservation applications and decisions.
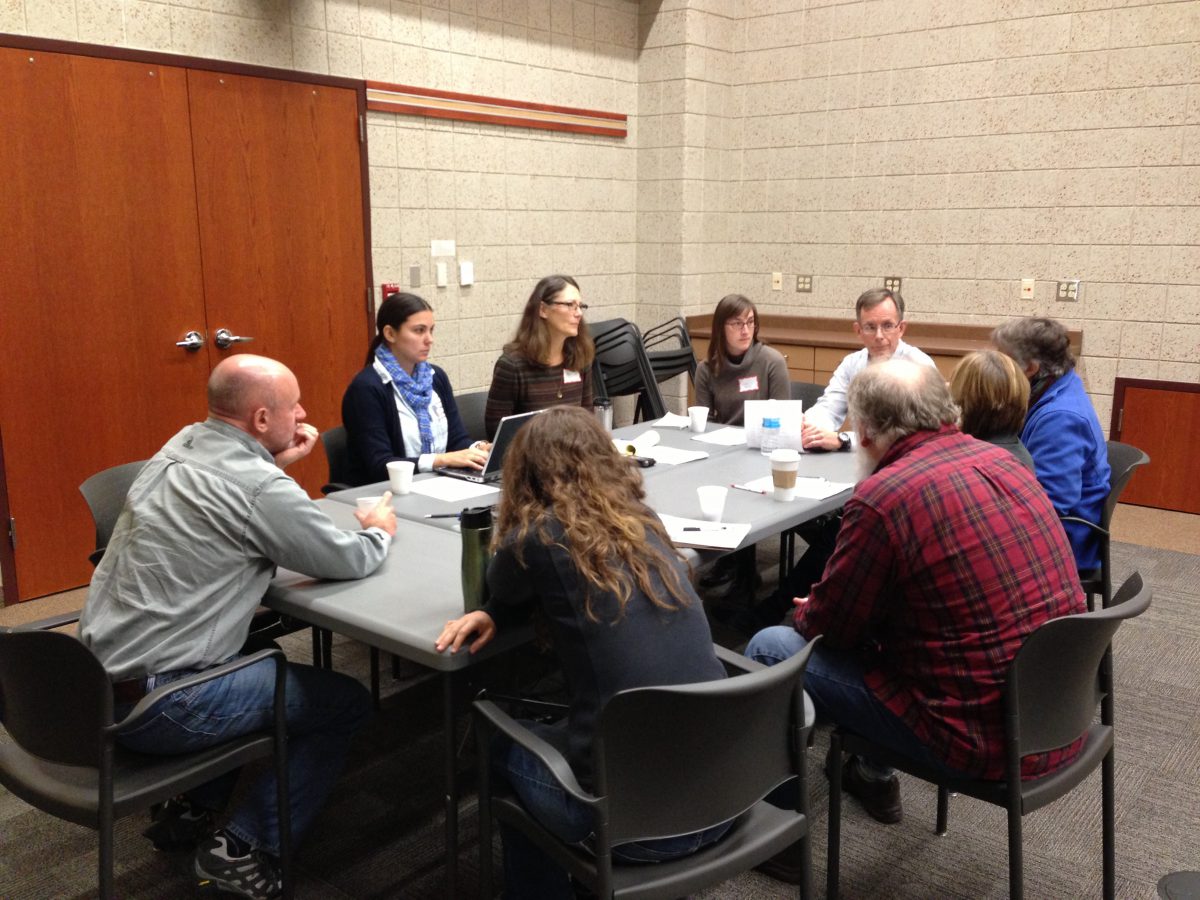
Wayne Thogmartin presenting to the group
Dr Bateman and Dr Pidgeon travelled to Chaska, MN to meet with regional United States Fish and Wildlife Service (USFWS) personnel during the early stages of their NASA funded project to identify the climate and extreme weather data needs of regional climate managers. The goal was to highlight how such data products can be used for targeted research of climate effects on wildlife at the refuge level. Their next workshop led Dr Bateman to Ft. Collins, CO where she presented the groups findings at the National Planning Workshop of the USFWS. Here, the focus was on broad landscape scale planning for the acquisition of refuges with the aim of buffering wildlife species from climate change related pressures. The trio along with other University of Wisconsin Researchers organized a multi-agency and organization meeting in La Crosse, WI which brought personnel such as the USFWS, Landscape Conservation Cooperative units, United States Geological Survey, the Northeast Climate Science Center, Long Point Waterfowl, as well as Wisconsin and Michigan Department of Natural Resources land managers. This two day workshop included presentations on data and research along with world café style brainstorming sessions to elicit suggestions and feedback from the attendees.. “We found that managers were really interested in maps of climate change and extreme weather for their regions, especially if they showed the uncertainty of the predictions,” said Bateman. The group is trying to keep their finger on the pulse of what data managers are looking for. “Refuge managers really wanted to see predictions specific to their refuge, while regional land managers wanted information at the landscape scale.” This highlights the need to provide data at different spatial scales to meet these various needs.
Project Research participants working with managers of protected areas
As part of a future webpage redesign, data from the project will be available for anyone interested. Users will have the ability to select an area of interest and download relevant data. “We want to always include end users in research, and update our results to meet those needs,” said Batemen. As a result of these workshops, she is currently working on a project using the USFWS designated surrogate species in predictions of species distributions under future changes in climate and extreme weather. These surrogate species were selected as a way to represent other groups of species, such as prairie pothole waterfowl, to provide strategic conservation planning and identify sensitivity of these species as proxies given future change in climate. This is just another way the trio is trying to keep up with the data and research desires of land managers.”
In the Altay region of Central Siberia, the forests are changing. Old-growth forest, which is needed to maintain a rich biodiversity, has been reduced drastically and now occurs mainly in protected areas. However, this important forest type is being threatened by logging, even within protected area borders, and conservationists are worried.
Logging within 50 m from black stork nest.
Although many protected areas within Altay allow some permits for logging, loggers are finding ways to cut corners and take more than their fair share. For example, some amount of selective logging might be allowed where 20% of individual trees are available for harvest, but loggers will end up removing closer to 80% of the trees. Sanitary logging, where old and dead trees can be harvested is also allowed, however, loggers often take younger, healthy trees instead. These types of logging are problematic and technically illegal, but to date have been hard to fight as finding the sites of illegal harvest is the proverbial needle in a haystack. Russian researcher Alexander Schur who visited SILIVIS in 2013 and 2014, along with SILVIS lab colleagues Matthias Bauman, and Eugenia Bragina, are at the forefront of tackling this problem, and using satellite technology to identify locations of old growth forest within protected areas that are being logged. To detect the illegal logging, they are using remotely sensed satellite imagery from Landsat in combination with forest inventory data collected by local forestry agencies. By looking at satellite images of the protected areas from different time periods, the goal is to identify where forest change had occurred, potentially identifying areas of illegal logging. The next step was to visit some of these identified disturbance areas, to check if logging had occurred or not, and this took place after Alexander returned to Altay. Overall, areas that suffered clear-cuts and high-intensity logging were well detected from the satellite imagery. In addition, areas of burnt ground were also well detected which is an important conservation concern for this region; fires in the Altay’s are often of anthropogenic origin as a byproduct of brush left behind after logging and is likewise detrimental to biodiversity. The use of these maps to detect logging is promising, because it allows for areas of forest disturbance to be easily identified, and this means that exhaustive searches by foot are no longer needed. In addition, having maps of disturbance across the entire protected areas makes it more difficult for loggers to hide their logging activities, handing the control back to the conservation practitioners and allowing to prosecute logging companies that act illegally. Forest conservationists are using the outputs of these maps to educate and raise awareness on the issues of illegal logging.
Great Spotted Eagle (IUCN status ‘vulnerable’), on the territory of a sanctuary
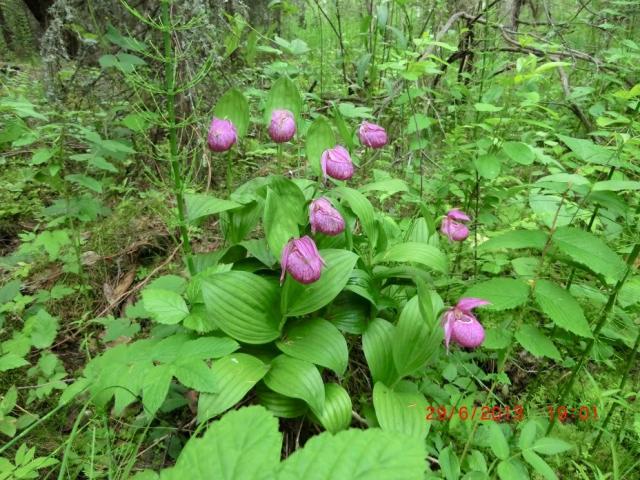
Conservation efforts are also underway, where information from forest disturbance maps are being used in conjunction with data collected on the location of rare and endangered plant and animal species that depend on old growth forest, such as Large-flowered Cypripedium orchids (Cypripedium macranthos), the Great Spotted Eagle (Aquila clanga) and the endangered black stork (Ciconia nigra). This information will then be used to designate special areas within the borders of protected areas where all logging is prohibited with the aim to protect old growth forest and subsequently biodiversity in central Siberia.”